


Paris Property Prices per m² by Arrondissement: 2027 Guide
Official prices per m² for all 20 Paris arrondissements, one-year and three-year trends, and the 2027 rules to know before buying or selling.


- Published on
- Reading time
- 16 min read
| Indicator | Figure | Period |
|---|---|---|
| Citywide price | €9,590/m² (-0.5% over one year) | End of August 2026 |
| Most expensive | 6th: €13,980/m² | Q2 2026 |
| Most affordable | 19th: €7,690/m² | Q2 2026 |
| Projected citywide price | €9,580/m² | November 2026 |
Introduction: One City, 20 Property Markets
Paris covers about 40 square miles, yet it holds 20 distinct property markets. A citywide average hides most of what matters. In the 6th, a square meter costs 1.8 times what it costs in the 19th.
The gaps continue inside each arrondissement. In the 12th, notarial data for late 2025 (opens in a new window) showed €8,180 per m² in the Bel-Air neighborhood and €10,940 in Quinze-Vingts, near Bastille. That is a 34% difference within one district.
Local data therefore drives every decision. Buyers use it to set a budget, sellers to set an asking price, and investors to compare entry cost with rental income.
| Price per m² | Arrondissements |
|---|---|
| Above €12,000 | 3rd, 4th, 6th, 7th |
| €10,000 to €12,000 | 1st, 2nd, 5th, 8th, 9th, 16th |
| €9,000 to €10,000 | 10th, 11th, 14th, 17th |
| Below €9,000 | 12th, 13th, 15th, 18th, 19th, 20th |
Paris Property Prices per m² by Arrondissement
The comparison below uses one source and one method for all 20 arrondissements. This matters, because mixing sources makes districts look cheaper or more expensive than they are. The first part gives the official prices. The second turns them into purchase budgets.
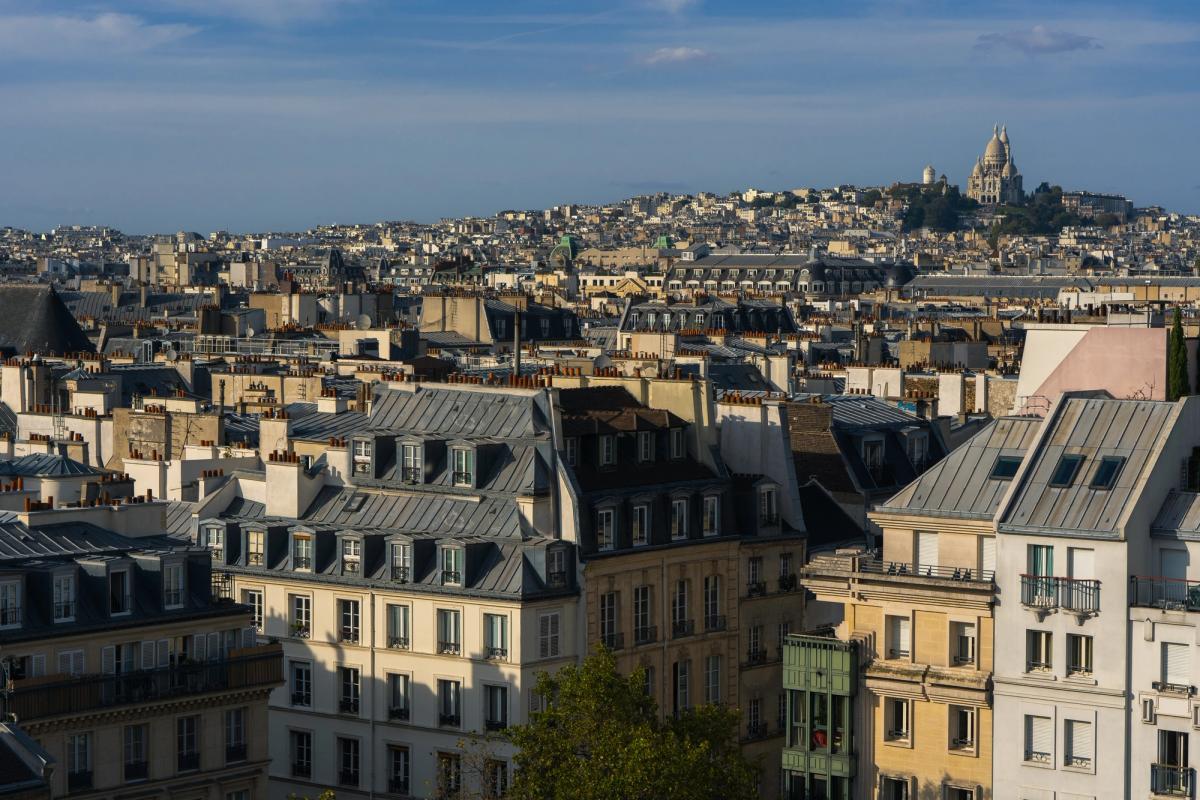
Official property prices across all 20 arrondissements
The figures are standardized prices for existing apartments. They are not median sale prices or asking prices. The series covers apartments sold vacant, by private agreement, in full ownership, and for residential use.
Four findings stand out:
- The 6th leads, followed by the 7th and the 4th. The 19th is the most affordable, ahead of the 20th and the 18th.
- The 6th also posted the strongest one-year rise (+5.0%), ahead of the 19th (+3.5%) and the 10th (+3.0%).
- Only the 3rd, 8th, and 15th declined over one year.
- All 20 arrondissements remain below their Q2 2023 level. The one-year gains are a partial recovery, not a new cycle.
| Arrondissement | Price per m² | One-year change | Three-year change |
|---|---|---|---|
| 1st | €11,840 | +0.1% | -10.2% |
| 2nd | €11,160 | +2.7% | -8.1% |
| 3rd | €12,420 | -2.7% | -1.4% |
| 4th | €12,760 | +0.6% | -3.5% |
| 5th | €11,590 | +2.1% | -7.6% |
| 6th | €13,980 | +5.0% | -0.2% |
| 7th | €13,010 | +1.4% | -4.5% |
| 8th | €11,620 | -0.8% | -2.3% |
| 9th | €10,140 | +0.3% | -4.3% |
| 10th | €9,140 | +3.0% | -5.2% |
| 11th | €9,500 | +2.3% | -5.1% |
| 12th | €8,610 | +1.3% | -4.8% |
| 13th | €8,560 | +0.7% | -1.9% |
| 14th | €9,100 | +0.4% | -1.5% |
| 15th | €8,780 | -1.1% | -5.9% |
| 16th | €10,220 | +1.8% | -4.1% |
| 17th | €9,470 | +2.0% | -6.1% |
| 18th | €8,490 | +1.0% | -7.1% |
| 19th | €7,690 | +3.5% | -8.0% |
| 20th | €8,210 | +1.7% | -5.6% |
What Would a Paris Apartment Cost?
Price per m² becomes clearer on a real surface area. The table multiplies the official price by 40 m² (about 430 sq ft) and 60 m² (about 645 sq ft).
These amounts are illustrations, not valuations. They exclude acquisition costs, agency fees, and renovation. They also show how far a budget travels. A sum that buys 40 m² in the 6th buys about 73 m² in the 19th.
| Arrondissement | 40 m² | 60 m² |
|---|---|---|
| 6th | €559,200 | €838,800 |
| 7th | €520,400 | €780,600 |
| 11th | €380,000 | €570,000 |
| 15th | €351,200 | €526,800 |
| 19th | €307,600 | €461,400 |
Which Paris Arrondissements Are Most Expensive?
Seven arrondissements exceed €11,500 per m². They share central locations and historic buildings, but their recent paths differ sharply. Since Q2 2021, the 6th has gained 4.1% while the 1st has lost 17.4%. Prestige alone does not protect value. Scarcity and the type of buyer matter more.
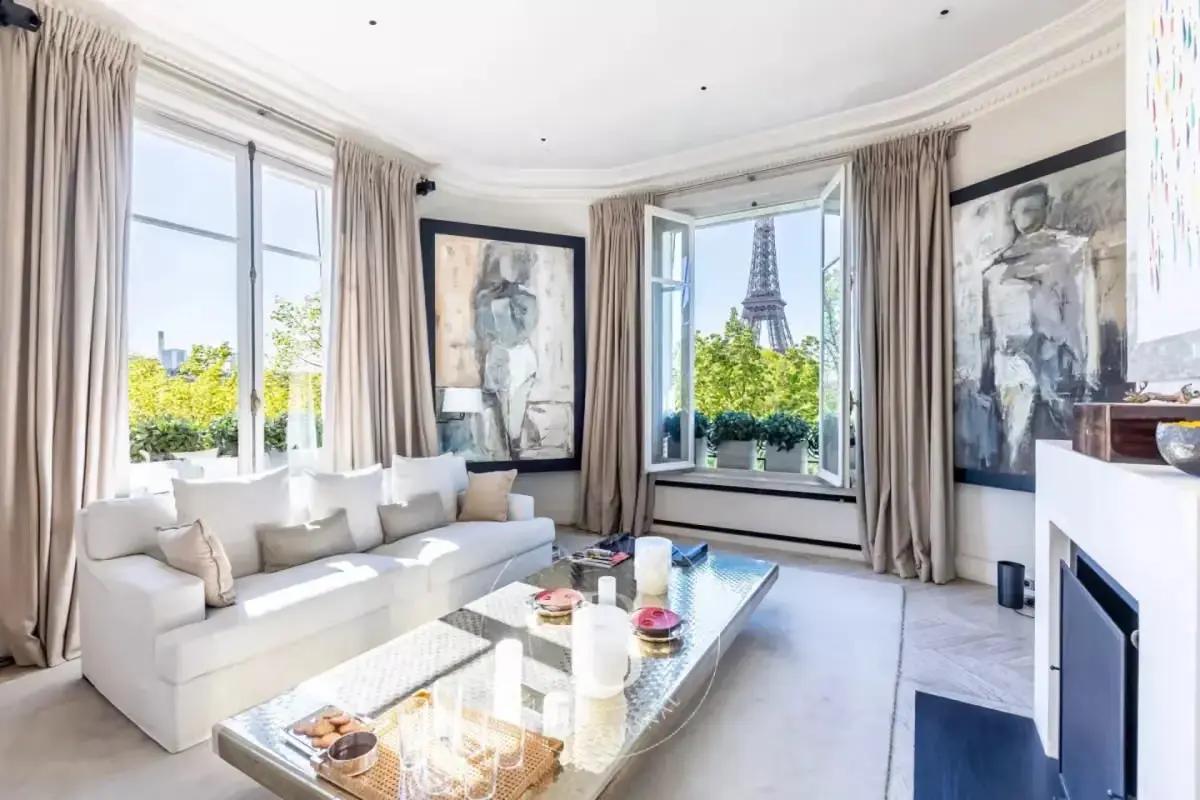
The 6th and 7th: Paris’s premium property market
The 6th covers Saint-Germain-des-Prés, Odéon, and the Luxembourg Gardens. The 7th includes Invalides, the Champ-de-Mars, and Gros-Caillou. Both offer landmark addresses and steady demand.
Supply explains their resilience. Large Haussmann-era apartments with reception rooms and balconies rarely come to market. Many buyers here pay cash, so higher mortgage rates affect them less. The 6th is now almost back to its 2023 level. Street-level detail is available in this profile of homes, prices, and daily life in Saint-Germain.
One caution applies. Regulated rents do not rise in proportion to purchase prices, so premium districts deliver lower rental yields.
The 4th and 3rd: the appeal of the Marais
The Marais combines 17th-century architecture, museums, and a lively street life. Demand concentrates around Place des Vosges, Île Saint-Louis, and the Upper Marais.
The spread between apartments is wide. A renovated unit in a well-kept building sells quickly, while one needing major work is negotiated firmly. The 3rd’s one-year decline of 2.7% needs careful reading. Small arrondissements record few sales, so the mix of apartments sold can move the figure from one quarter to the next. Its three-year change of -1.4% is among the smallest in Paris.
The 1st, 5th and 8th: established prestige locations
Each district attracts a different buyer:
- The 1st (Louvre, Palais-Royal) suits buyers who want a central base. Its three-year decline of 10.2% is the steepest in the city.
- The 5th (Latin Quarter, Panthéon) draws families and academics who value schools and universities.
- The 8th (Golden Triangle, Monceau) offers large, formal apartments near business districts. It stands slightly above its 2021 level.
| Arrondissement | Q2 2026 price per m² | One-year change | Change since Q2 2021 |
|---|---|---|---|
| 6th | €13,980 | +5.0% | +4.1% |
| 7th | €13,010 | +1.4% | -2.5% |
| 4th | €12,760 | +0.6% | -8.3% |
| 3rd | €12,420 | -2.7% | -4.3% |
| 1st | €11,840 | +0.1% | -17.4% |
| 8th | €11,620 | -0.8% | +0.6% |
| 5th | €11,590 | +2.1% | -11.3% |
Where Are Paris Property Prices More Affordable?
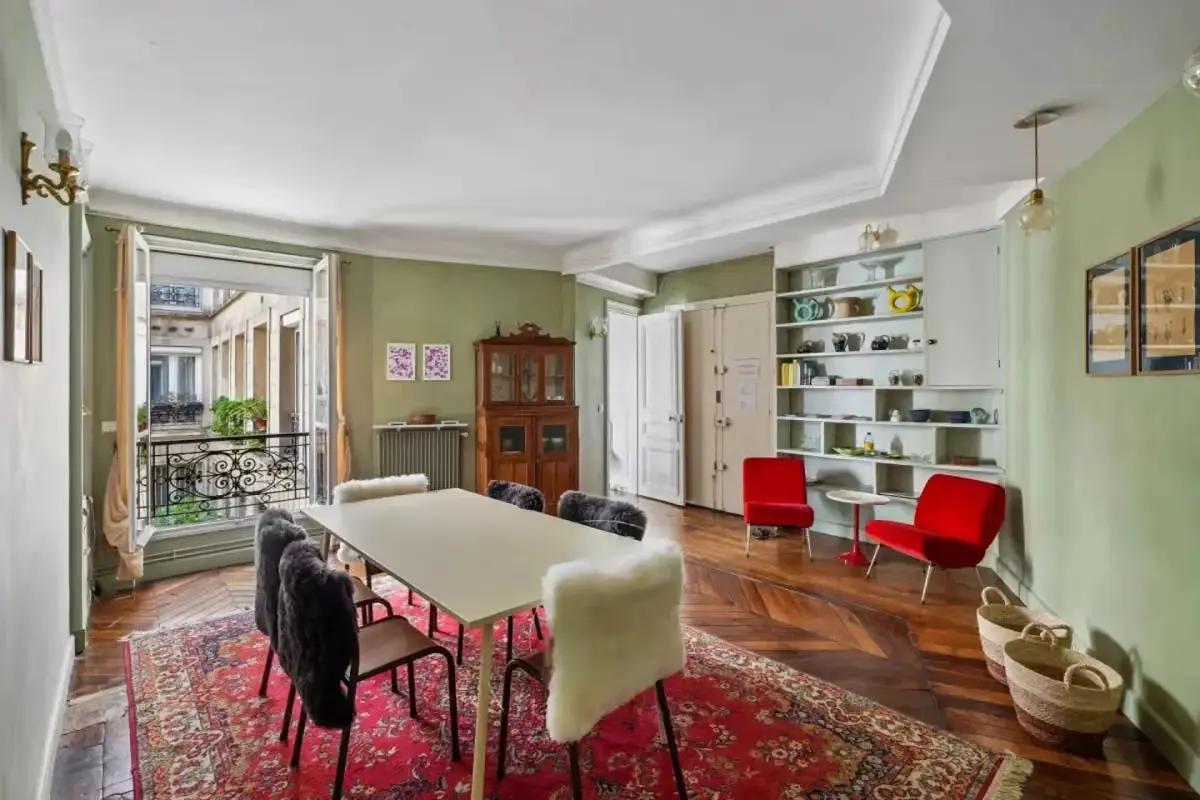
Six arrondissements sit below €9,000 per m², all in the north, east, and south. They attract first-time buyers and families who need space. They also fell furthest during the correction, because their buyers depend more on mortgages. That history creates opportunity, but selection matters more here than anywhere else.
The 19th, 20th and 18th: more accessible prices
These three arrondissements are the only ones below €8,500 per m². The 19th offers residential streets around Buttes-Chaumont park and the Ourcq canal. The 20th includes Belleville, Ménilmontant, and the area around Père-Lachaise.
The 18th is the most contrasted. Montmartre and Jules Joffrin command prices far above blocks farther north and east. Neighborhood-level notarial figures (opens in a new window) place the Goutte-d’Or area near €6,640 per m², the lowest in the city.
The 19th and 10th led the one-year recovery outside the 6th. Lower entry prices bring buyers back first when confidence improves. Buyers new to Paris should still review the areas that call for extra caution before they shortlist an address.
The 12th and 13th: family-friendly alternatives
The 12th offers Bercy, Nation, and direct access to the Vincennes woods. The 13th includes the village-like Butte-aux-Cailles and the modern district around the national library.
Both combine parks, schools, and calm residential streets. Their prices have been steadier too. The 13th is down only 1.9% over three years. Many of its buildings date from after 1970, with elevators and efficient layouts that suit families.
The 14th and 15th: established residential markets
The 14th covers Montparnasse, Alésia, and Denfert-Rochereau. The 15th includes Convention, Vaugirard, and Beaugrenelle. Both offer family apartments, strong transport links, and complete local services.
The 15th is the largest arrondissement by population, so it records many sales and its figure is statistically robust. Its one-year decline of 1.1% is therefore a real signal. Building quality varies widely, especially in 1960s and 1970s residences with high charges.
A useful rule: the cheapest arrondissement is not always the best value. Compare condition, long-term appeal, and resale prospects before comparing price.
| Arrondissement | Q2 2026 price per m² | One-year change | Change since Q2 2021 |
|---|---|---|---|
| 19th | €7,690 | +3.5% | -16.6% |
| 20th | €8,210 | +1.7% | -11.1% |
| 18th | €8,490 | +1.0% | -16.0% |
| 13th | €8,560 | +0.7% | -8.2% |
| 12th | €8,610 | +1.3% | -12.1% |
| 15th | €8,780 | -1.1% | -13.1% |
| 14th | €9,100 | +0.4% | -10.9% |
How Have Paris Property Prices Changed?
A single quarter says little without the cycle behind it. Paris has moved through three phases since 2020: a peak, a correction, and a plateau. Knowing which phase applies helps buyers judge timing and helps sellers set expectations.
From the 2021 peak to the 2024 correction
Prices climbed for years before peaking between 2020 and 2022, depending on the arrondissement. Mortgage rates then rose sharply. Borrowing capacity fell, and many buyers paused.
The correction was uneven. In the notarial series, the 1st fell from €14,330 per m² in Q2 2021 to €11,840 in Q2 2026. The 19th fell from €9,220 to €7,690. The 6th moved the other way, from €13,430 to €13,980. Districts that depend on financed buyers adjusted most.
Signs of stabilization in 2025 and 2026
Buyers returned gradually. In the second quarter of 2026, Paris recorded 20% more sales than a year earlier, the strongest rise in the region. Momentum then cooled over the summer. Between June and August, Paris apartment sales slipped about 2% over one year.
Prices barely moved throughout. The notaries observe first-time buyers returning, often with family support, while owners who must sell a home financed at very low rates find it harder to move. Investment in existing rental property remains very limited.
Why are some arrondissements recovering faster?
The 19th, 10th, and 6th rose 3% to 5% over one year, while the 3rd, 8th, and 15th declined. Four factors explain the gap:
- Buyer budgets: lower entry prices bring first-time buyers back sooner.
- Supply: scarce stock supports prices in the 6th.
- Financing: cash-rich districts react less to interest rates.
- Sales mix: a few exceptional sales can shift a small district’s figure.
| Period | Price per m² | One-year change |
|---|---|---|
| End of February | €9,580 | +0.9% |
| End of July | €9,550 | -0.5% |
| End of August | €9,590 | -0.5% |
| November (projection) | €9,580 | -0.4% |
How to Read Paris Property Price Data
Two websites often show different prices for the same arrondissement. Neither is necessarily wrong. They measure different things, over different periods. Three distinctions resolve most of the confusion.
Median, average and standardized prices
- Average price: the arithmetic mean of recorded prices. A few exceptional properties can pull it up.
- Median price: the middle value. It is less affected by unusual sales.
- Standardized price: a notarial measure that corrects for differences in the properties sold each quarter.
The standardized price is best for tracking trends, because it compares like with like. The main table in this guide uses it.
Recorded sales vs asking prices
France publishes an open database of completed sales (opens in a new window), drawn from land and tax records. It shows what buyers paid, address by address, with a delay of several months.
Property portals mostly display asking prices. These reflect seller expectations, and final prices are often lower. Figures from two sources should never be mixed in one comparison.
For a regional benchmark, INSEE’s price index for existing apartments in the Paris region (opens in a new window) tracks quarterly movements. It read 116.9 in Q2 2026, compared with 124.6 in Q2 2023, a 6.2% decline. That index covers the whole region, not Paris alone.
Why street-level data matters
An arrondissement figure is a starting point. A reliable estimate needs recent comparable sales nearby, the number of sales behind each figure, and the exact floor, condition, and features of the property. A district average built on a handful of sales deserves less weight than one built on hundreds.
| Measure | What it shows | Main limitation |
|---|---|---|
| Standardized price | Trend adjusted for the mix of properties sold | Not a valuation of one apartment |
| Median of recorded sales | The middle price actually paid | Shifts with the type of properties sold |
| Asking price | Seller expectations | Often above the final price |
What Drives Property Prices Within an Arrondissement?
The arrondissement sets a range. Four groups of factors decide where a given apartment falls within it. Together they can move the price by 20% or more between two homes on the same street.
Neighborhood, street and transport links
Buyers pay more for homes near subway stations, good schools, parks, and shops. A quiet street usually outperforms a busy boulevard. Some addresses carry a lasting premium, and planned transport projects can lift a micro-market over time.
Building condition and co-ownership costs
Most Paris apartments sit in co-owned buildings, and the building’s health affects value directly. Buyers should check the roof and facade, the elevator, quarterly charges, and work already voted. The minutes of the last three owners’ meetings reveal most of this. A facade or roof project can cost each owner tens of thousands of euros, and informed buyers deduct it from their offer.
Floor, light, views and outdoor space
Higher floors with an elevator sell at a premium. Natural light, orientation, and open views count heavily. So do balconies, high ceilings, and period features such as moldings and fireplaces. Ground floors, dark rooms, and overlooked windows reduce value.
Energy ratings and renovation costs
The energy performance certificate grades each home from A to G. A poor rating signals higher bills and likely renovation. For investors, it can also restrict the right to rent. A well-rated apartment therefore tends to sell faster and closer to its asking price than a comparable unit rated F or G.
| Factor | Supports value | Reduces value |
|---|---|---|
| Street | Quiet, near transit and shops | Heavy traffic, noise |
| Building | Well maintained, moderate charges | Major work pending |
| Floor and light | High floor, open view, balcony | Ground floor, dark |
| Energy rating | A to D | F or G |
What Should Buyers and Sellers Do With These Figures?
Price data only helps when it changes a decision. In a flat market, the margin for error is small on both sides. Buyers cannot count on appreciation to absorb an overpayment, and sellers cannot count on rising prices to rescue an ambitious listing.
How buyers should set a realistic budget
Start with the total budget, not the price per m². Acquisition costs come on top. According to the French notaries’ breakdown of purchase costs (opens in a new window), they reach roughly 7% to 8% of the price for existing property and 2% to 3% for new-build property. Most of this is tax. Since April 2025, departments may add 0.5 percentage points to the transfer duty rate (opens in a new window), and Paris applies it.
On a €380,000 apartment, that means roughly €27,000 to €30,000 in addition to the price. Buyers should also budget for renovation and confirm financing early. Those purchasing from abroad can review the costs, steps, and rules for foreign buyers in France.
How sellers should set an asking price
Sellers should rely on recent completed sales, not on competing listings. Comparable apartments must match on size, floor, and condition. The energy rating and any pending building work belong in the calculation. Values from 2021 or 2022 are no longer a reference in most districts.
A structured method helps. Owners can follow the main ways to estimate a Paris property’s value before they meet an agent.
How to negotiate based on local market data
Good negotiation rests on evidence. Buyers should bring comparable sales and renovation quotes to support an offer. Sellers can use the same data to defend a fair price. Neither side should assume a property will sell at the arrondissement average.
| Property type | Typical cost | Main component |
|---|---|---|
| Existing property | About 7% to 8% | Transfer duties |
| New-build property | About 2% to 3% | Reduced duties |
Is Paris Property a Good Investment in 2027?
Paris offers deep rental demand, but returns are shaped by regulation as much as by price. Three sets of rules apply: rent control, energy standards, and local taxes. Investors who model them before buying avoid most unpleasant surprises.
Gross yield vs net rental yield
Gross yield is annual rent divided by purchase price. Net yield is what remains after property tax, building charges, maintenance, insurance, vacancy, and management.
Entry prices in the 19th are 45% below those in the 6th, while regulated rents differ far less. Gross yields are therefore higher in the north and east. Local taxes also weigh on net returns. Paris has applied a property tax rate of 20.5% since 2023, and second homes face a surcharge of up to 60% on the residence tax (opens in a new window). Readers weighing ownership against renting can compare the financial case for renting or buying in Paris.
Paris rent control and rental income
Rent control applies to homes used as the tenant’s primary residence and to mobility leases. The base rent cannot exceed the increased reference rent, set 20% above the reference rent. The amount depends on location, number of rooms, construction period, and whether the unit is furnished.
A rent supplement is possible only for exceptional features, under the official rules on rent amounts in Paris (opens in a new window). Homes rated F or G cannot carry one. Landlords who breach the rules risk a fine of €5,000, or €15,000 for a company.
The system was due to expire in November 2026. On November 19, 2026, lawmakers approved a two-year extension, to November 2028.
Energy rules for rental properties
France is phasing out rentals of the least efficient homes. G-rated homes have been barred from new or renewed leases since January 1, 2025, with F-rated homes following in January 2028 and E-rated homes in January 2034. An F-rated apartment bought in 2027 has less than a year of rental eligibility left without improvement work.
What changes on January 1, 2027?
The calculation of energy ratings changes again. The electricity conversion coefficient drops from 1.9 to 1.7, under the new rating rules for electrically heated homes (opens in a new window).
Many electrically heated homes will gain a better rating without any work. About 300,000 primary residences should leave the F and G categories, by the government’s estimate, and owners with a valid certificate can obtain an updated rating online, with no new inspection.
Many small Paris apartments use electric heating, so the change matters locally. Some F-rated studios may become rentable beyond 2028. Buyers should request the updated rating before estimating renovation needs. A better label does not guarantee a higher price.
Which arrondissements suit different investment goals?
- Central arrondissements suit long holding periods and capital preservation.
- Northern and eastern arrondissements suit investors comparing entry prices and gross yields.
- The 12th, 14th, and 15th balance liquidity, space, and rental demand.
| Rating | Rental status | Key date |
|---|---|---|
| G | Banned for new or renewed leases | Since January 1, 2025 |
| F | Ban scheduled | January 1, 2028 |
| E | Ban scheduled | January 1, 2034 |
What Is the Outlook for Paris Property Prices in 2027?
No full-year 2027 prices exist yet, so any outlook rests on leading indicators. Three are worth watching: preliminary sale agreements, mortgage rates, and sales volumes. Together they point to stability, with risks tilted toward slower activity.
Base case: a cautious, uneven market
Preliminary agreements put Paris at €9,580 per m² for November 2026, almost unchanged. Borrowing costs have crept up. According to the Bank of France’s monthly lending statistics, the average rate on new home loans held at 3.32% in September 2026, up from 3.08% in December 2025. The average loan for a primary residence now runs over 23 years.
National activity is slowing as well. France’s notaries counted 951,000 existing-home sales in the 12 months to August 2026. They warn the total could slip to about 920,000 by year-end. These national figures are context, not a Paris forecast.
What could push prices higher or lower?
Stable mortgage conditions, limited supply of quality apartments, and steady demand for good locations support prices. The 2027 energy rating change may also return some small apartments to the rental market.
The main risk is financing. The notaries consider rates above 4% a worrying threshold: purchasing power would shrink, and owners holding cheap 2019 to 2021 loans would be less willing to move. Economic uncertainty and renovation costs add pressure.
Advice for buyers, sellers and investors
- Buyers: compare recent local sales and negotiate. Nothing in the data signals a sharp rise.
- Sellers: price from current comparable sales. Overpriced listings stall in a flat market.
- Investors: check rent caps, the energy rating, and net yield before committing.
- Long-term owners: focus on quality and location, not short-term movements.
| Indicator | Latest figure | Period |
|---|---|---|
| Paris price projection | €9,580/m² | November 2026 |
| Rate on new home loans | 3.32% | September 2026 |
| Existing-home sales in France | 951,000 over 12 months | August 2026 |
| Electricity coefficient | 1.7 (from 1.9) | January 1, 2027 |
When Does Local Property Advice Make a Difference?
Arrondissement averages are useful for research. They cannot price one specific apartment. Floor, light, condition, energy rating, and building health all move the result.
Estate in Paris works at that level of detail. Buyers receive tailored support for buying an apartment in Paris, including value assessment and selected off-market homes. Sellers benefit from pricing built on real neighborhood sales, as part of a managed sale of a Paris property. Investors get guidance on price, renovation costs, and rental constraints before making an offer.
Owners can also request a confidential valuation of a Paris property, based on recent signed sales nearby, with a response within 24 working hours.
| Profile | Main question | Support |
|---|---|---|
| Buyer | Is this apartment fairly priced? | Search, value assessment, off-market access |
| Seller | What price will the market accept? | Valuation based on signed sales |
| Investor | Do the numbers work? | Review of price, work, and rental rules |
FAQs
The latest official figure is €9,590 per m² for existing apartments at the end of August 2026. This is a standardized notarial price. Medians and asking prices use other methods and give different results.
Conclusion
Paris is not one property market. The 6th and 7th remain the most expensive arrondissements, while the 19th, 20th, and 18th offer the most accessible entry prices. Value depends on far more than the district: street, building, light, and energy rating all count. Buyers, sellers, and investors should rely on recent sales and factor in the 2027 rules on energy ratings and rents. For a precise figure on a specific property, contact Estate in Paris for a valuation or tailored advice.